A useful skin experiment answers a defined question: what happened when a particular preparation was compared with something else, under specified conditions? A cream comparison asks a further question: how much of that finding survives when the product, setting or intended user changes? Moving between those questions requires evidence about the connection. An ingredient name alone cannot supply it.
This article develops a way to examine that connection. Start with the identity of the preparation, follow the measurements through the analysis, and then test the claim being proposed. The numerical examples below are deliberately invented teaching examples, not additional trial findings. Their purpose is to make otherwise hidden assumptions visible, especially when two measurements belong to the same person or a final visit is missing.
Study figure and data
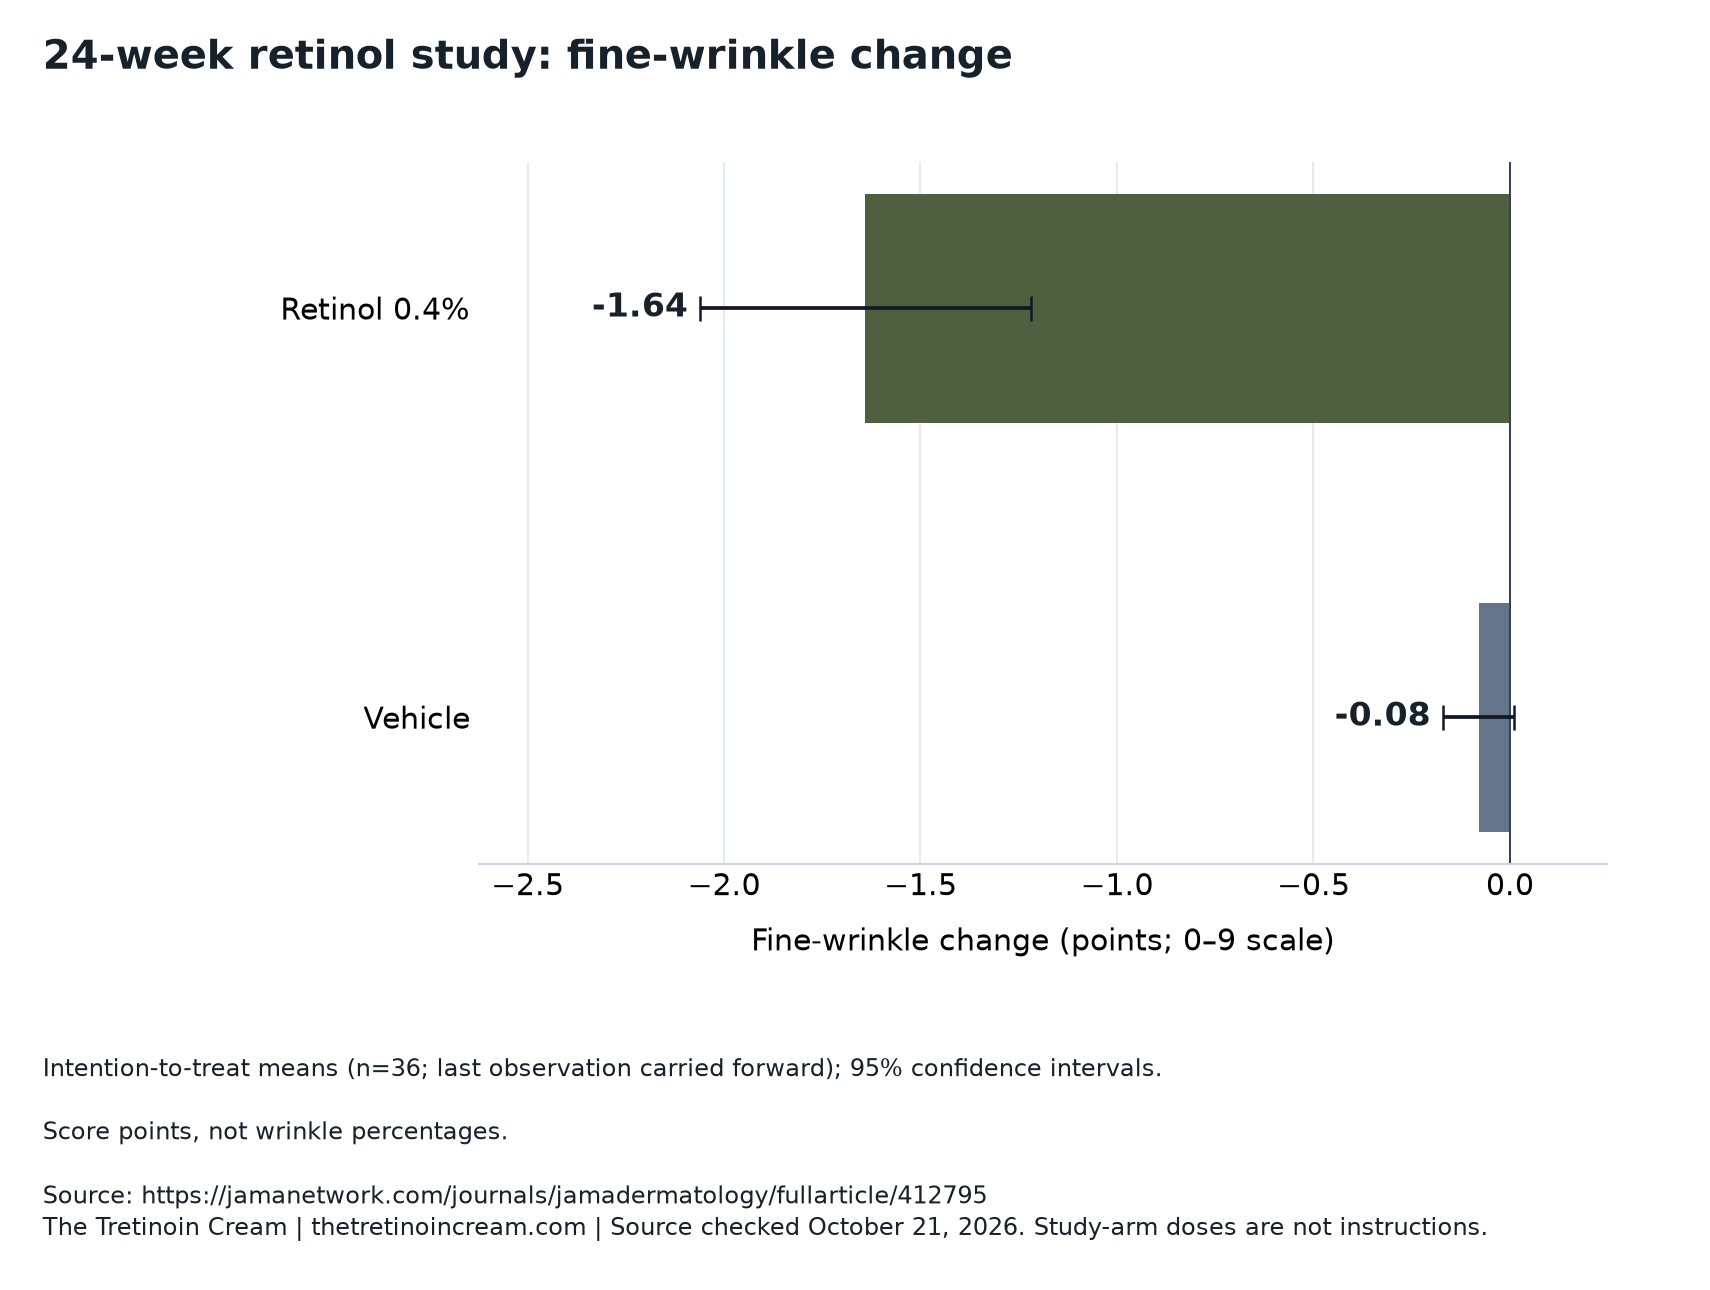
Intention-to-treat means (n=36; last observation carried forward); 95% confidence intervals.
Score points, not wrinkle percentages.
Download source-labeled chart (PNG)Download chart data (CSV)Download vector chart (SVG)
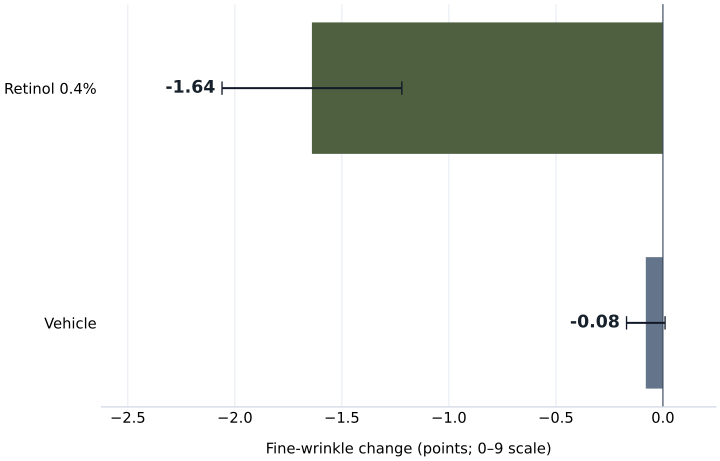
| Study group | Reported value | 95% confidence interval |
|---|---|---|
| Retinol 0.4% | -1.64 | -2.06 to -1.22 |
| Vehicle | -0.08 | -0.17 to 0.01 |
Sections in this article
Start with the preparation's identity
Randomization assigned treatment sides. To interpret a controlled formulation experiment, first separate the treatment being tested from the ingredients it shares with its comparator. A vehicle is the preparation used as the control, usually designed to retain the surrounding base while omitting the experimental active ingredient. The resulting comparison concerns what adding that ingredient does within that particular preparation. It is not automatically a comparison between the ingredient and doing nothing.
Consider an explicitly hypothetical experiment involving a gel and its matching base. Suppose both groups improve, but the active group improves more. Subtracting the control response addresses the additional effect under those experimental conditions. Comparing only the active group's starting and finishing measurements would instead combine that additional effect with everything else that changed during follow-up. These are different questions, even if the photographs look equally persuasive.
For a cream comparison, the next task is documentary: establish what the finished preparations contain and how they were evaluated. A shared ingredient is one matching feature, not a complete identity check. Our cream and lotion comparison guide provides a starting point for organizing those product documents.
Keep each person's measurements together
In a within-person comparison, the useful quantity is often the difference between that person's two responses. Treating both observations as though they came from unrelated people discards information about their connection. A person whose skin responds strongly on one side might also show a strong response on the other. That tendency matters when estimating how precisely the treatments differ.
Here is an invented example using an arbitrary response scale where larger values mean more improvement. Three people show active/control responses of 5/4, 8/7 and 3/2. Each paired difference is one point, despite considerable variation in the separate active and control values. Now rearrange only the control responses to 2, 4 and 7. Both group averages remain unchanged, but the paired differences become 3, 4 and minus 4. The average difference is still one; its variability is very different.
That is why separate group summaries do not contain everything needed for a paired analysis. The connection between observations, often expressed as correlation, helps determine uncertainty. The lesson concerns the structure of the data, not a reason to favor one ingredient. It also explains why counting treated sites is not the same as counting independent participants.
| Illustrative person | Original active / control | Control reassigned |
|---|---|---|
| A | 5 / 4: difference 1 | 5 / 2: difference 3 |
| B | 8 / 7: difference 1 | 8 / 4: difference 4 |
| C | 3 / 2: difference 1 | 3 / 7: difference −4 |
Distinguish the plan from exposure received
Staff applications: planned up to three weekly; actual mean 1.6. Those are historical study details, not instructions for a personal routine. A treatment policy and the amount of treatment actually received are different descriptions of an intervention. An average summarizes delivery, but does not reveal whether everyone received a similar amount or whether exposure varied substantially between people and over time.
Imagine a separate, hypothetical study in which researchers permit treatment pauses when discomfort occurs. Its result evaluates the approach as implemented, including those pauses. It would be a mistake to replace that result with a prediction about uninterrupted exposure merely by multiplying the improvement by the ratio of scheduled to completed applications. That calculation assumes a straight-line relationship between exposure and benefit, while also assuming the people who paused would respond like those who did not.
A stronger exposure analysis would connect each person's treatment history, symptoms and measurement times. Even then, comparing frequent users with infrequent users would need care: reasons for receiving less treatment could also predict the outcome. The irritation and follow-up guide helps separate a clinical conversation about symptoms from an attempt to reverse-engineer a regimen from an old paper.
Make missing follow-up an explicit assumption
Last observation carried forward means using a person's most recent available measurement in place of a later missing one. It keeps a value in the analysis, but it cannot tell us what would actually have happened afterward. A flat continuation is an analytical choice. Whether it favors or disfavors a treatment depends on the trajectories that were not observed and on why follow-up stopped.
Consider another invented example. Suppose a participant's last measured improvement is two points, with the final visit missing. Carrying that observation forward assigns two points to the final visit. A sensitivity analysis might also examine zero improvement or four points. Neither alternative is a recovered fact. They are different assumptions whose consequences can be calculated. If a conclusion changes under small, plausible alterations, readers should know that it depends heavily on the missing observations.
Withdrawal reasons help organize these questions without proving an answer. An injury, practical difficulty and discomfort may have different relationships to future skin measurements. Pooling every departure into one unexplained category conceals that possibility. Conversely, assigning all departures a poor outcome would also be an assumption. Useful sensitivity work specifies the alternatives, explains their rationale and shows how far the conclusion moves.
Ask which quantity an error bar describes
Publisher Figure 2: 23 completers, standard-error bars. A standard error describes uncertainty in an estimated mean; a confidence interval expresses a range constructed by a specified statistical procedure. They are related ideas, but their displayed widths are not interchangeable. Before comparing two graphics, identify the population included, the quantity estimated and the meaning of the bars.
A confidence interval around an average also does not show where most individual results fall. To illustrate, imagine a large hypothetical sample with a precisely estimated average but very varied individual responses. Its interval for the mean could be narrow while its individual outcomes remain widely spread. The interval answers a question about estimation, not a promise about a future person's result.
For paired data, the uncertainty of the treatment difference depends on the variability of the paired differences. Subtracting the two lower confidence limits and then the two upper limits does not recover that interval. Nor does the amount of overlap between two separate bars substitute for the intended statistical comparison. These distinctions are useful when reading the companion concentration analysis: a visually close pair of estimates still needs an appropriate comparison and a clinically meaningful interpretation.
Translate a score without changing its meaning
A rating summarizes a judgment made with a defined scale. Its numerical appearance can tempt readers to treat it like a physical measurement of surface area or a count of individual wrinkles. Before doing arithmetic, ask what a one-point difference represents, how ratings were assigned and whether the scale supports the interpretation being proposed.
For example, take an invented severity score that falls from six to three. The arithmetic reduction in the score is half its starting value. That does not establish that half the wrinkles disappeared, that skin became half as old, or that the person experienced twice the benefit of someone improving by fewer points. Those claims require a relationship between the rating and the additional outcome. A numerical scale cannot provide that relationship merely because it has a zero.
An average also leaves open how improvement is distributed. A modest average might reflect similar small changes across participants or a mix of larger changes and little change. To distinguish those patterns, one would want individual response distributions or a clearly defined responder analysis. Choosing the response threshold after seeing the data can make a result look more favorable; specifying its clinical meaning in advance makes the interpretation easier to assess.
Test every step from tissue to function
Biopsies: increased glycosaminoglycan (n=6) and procollagen I staining (n=4); only significant findings reported. A laboratory observation can suggest a biological pathway without establishing every later step in that pathway. Tissue staining, the amount of a molecule, the organization of a tissue and its ability to resist injury are different quantities. A convincing argument connecting them needs measurements that address the links, rather than a sequence of plausible-sounding descriptions.
Selective reporting creates another problem. Imagine an explicitly hypothetical investigation that examines several laboratory outcomes and presents only the favorable ones. Readers see a concentrated set of successes without seeing the complete set of opportunities for a positive finding. The concern is not that every displayed result must be false. It is that the displayed collection can exaggerate how consistently the underlying investigation supports the proposed explanation.
A more informative mechanistic program would specify the laboratory questions in advance, report the unsuccessful as well as successful measurements, and test whether the proposed mechanism tracks a relevant clinical outcome. Evidence that a marker changes and evidence that changing that marker causes a benefit answer different questions. Repeated measurement may help establish sequence, but sequence alone cannot settle causation or exclude another explanation.
Build a bridge to the intended use
Moving a finding to another setting is a problem of transportability: deciding which features of the original comparison must remain sufficiently similar. The relevant features depend on the claim. A statement about a named preparation requires product identity. A statement about a clinical outcome requires a matching outcome definition. A statement about a new population requires reasons to expect the comparison to remain applicable there.
A useful bridge is therefore more specific than a shared ingredient label. Suppose a hypothetical new cream has the same nominal active concentration as an experimental preparation. That similarity does not establish equivalent delivery, stability, tolerability or clinical performance. Each is a separate proposition. Documentation could narrow the uncertainty, and a direct comparison could address it, but renaming all of those propositions as ingredient evidence would hide the work still required.
The retinoid terminology guide helps organize names before making comparisons. To practice checking a retail description, the Vibriance Retinol Serum review is a place to examine the documentary record. That link is an invitation to inspect product information, not a claim that the product matches a research preparation or reproduces a trial result.
| Proposed connection | Evidence to seek | Question it addresses |
|---|---|---|
| Same ingredient name | Documented active identity and formulation | What is being compared? |
| Same delivered exposure | Relevant delivery and stability measurements | Does nominal content describe exposure? |
| Same clinical benefit | Direct clinical comparison with matched outcomes | Does performance transfer? |
| Same intended users | Applicable population and setting data | For whom is the comparison informative? |
Use neighboring evidence for distinct questions
The 1995 tretinoin abstract describes 99 completers over 48 weeks: similar facial improvement with 0.1% and 0.025% creams, but more irritation with 0.1%. The 2005 randomized study abstract describes 204 treated participants and greater facial improvement with 0.05% emollient cream than vehicle over two years. These are tretinoin investigations, not direct retinol comparisons. Neither abstract supplies a conversion between the ingredients or a retail product ranking.
The accessible 2005 publisher acknowledgment documents OrthoNeutrogena support and employment, equity, research and consulting relationships. Its full methods and results were not reviewed here; the 1995 analysis likewise uses the indexed abstract. Access matters because a short report may support a broad description while leaving the details needed for a more ambitious comparison unresolved. Acknowledged support identifies a relationship; it does not, by itself, determine whether a result is correct.
The scientific use of this neighboring evidence is to formulate better questions. Does a proposed comparison separate appearance from irritation? Does it preserve the difference between a study's duration and a product's demonstrated indication? The guide to reading tretinoin trials can help structure that reading. Combining papers should preserve their questions, rather than turn unlike measurements into an invented league table.
Assemble evidence that could change a decision
Four inventors disclosed conditional royalties; this does not establish funding. Separately, current RENOVA labeling concerns tretinoin cream 0.02% as an adjunct for fine facial wrinkles alongside comprehensive skin care and sunlight avoidance. Its safety and effectiveness above age 71 are unestablished. These facts belong to different documents and different products; putting them on one page does not merge their evidentiary authority.
An original editorial approach to comparing products is to write down the decision before collecting reassuring details. If the decision concerns tolerability, seek comparative symptom and discontinuation data. If it concerns a visible outcome, seek an applicable clinical measurement. If it concerns what a service supplies, seek the product and prescribing documents. The Nurx tretinoin cream review provides another documentary starting point, without implying a match to the experimental preparations discussed here.
Then identify what new information would actually change the conclusion. A direct formulation comparison could address uncertainty that an additional ingredient description cannot. Better follow-up could address missing outcomes that a more elaborate graphic cannot recover. This turns scientific reading into a set of answerable questions. It also keeps the final judgment proportional to the evidence, with product identity, benefit, tolerability and suitability considered as separate parts of the decision.
Questions about the evidence
Why not compare the largest number in each paper?
The numbers may describe different outcomes, scales, populations or comparators. A larger numerical change on one scale need not represent a larger clinical benefit. First define the comparison you want to make; then determine whether the reported quantities can answer it without changing their meaning.
Can a missing measurement be handled objectively?
The method can be explicit and reproducible, but it still relies on assumptions. A useful analysis explains those assumptions and tests alternatives. The aim is to show how much the conclusion depends on the unseen values, rather than to make missingness disappear from the reader's view.
Does a narrow confidence interval predict my response?
An interval for a group mean describes precision in estimating that mean under the analysis. It is not an interval for every person's future outcome. Individual variation, the match between populations and uncertainty about a different formulation require separate evidence; precision cannot resolve all three at once.
What would make a laboratory explanation more convincing?
Look for a prespecified question, complete reporting, repeatable measurements and evidence connecting the proposed mechanism to the relevant clinical outcome. A favorable marker result is one contribution. Showing that it explains a benefit requires additional work that distinguishes the proposed pathway from competing explanations.
What should a product review add to scientific reading?
It should help identify the exact product and the documents needed to assess a claim. Editorial interpretation should distinguish documented facts from unanswered questions. A review becomes more useful when it explains what evidence would close a specific gap, rather than attaching a study result to a similar ingredient name.
Editorial assessment
The central task in a cream comparison is connecting a defined preparation to a defined claim. Paired measurements, exposure histories, missing observations and outcome definitions determine what a clinical estimate means. Laboratory evidence and product documentation then answer additional, distinct questions. A careful reader can use each contribution without asking it to prove the entire case. The most informative next study is the one that addresses the remaining decision, with the relevant formulation, comparator and outcome specified before the results are known.
Research access and limitations
The worked numerical examples are original illustrations, not participant data or reconstructed trial results. This analysis does not supply an individual treatment regimen, a head-to-head retail comparison or a substitute for a clinician's assessment of an identified product.
Sources and access notes
Sources checked October 22, 2026. Access notes identify the material examined for this article.
- Improvement of naturally aged skin with vitamin A (retinol).
Full publisher research article, including original clinical table-image footnote, figure captions, Comment and Financial Disclosure; no supplements or individual data reviewed. · Checked October 21, 2026
- Two concentrations of topical tretinoin (retinoic acid) cause similar improvement of photoaging but different degrees of irritation. A double-blind, vehicle-controlled comparison of 0.1% and 0.025% tretinoin creams.
Indexed original research abstract · Checked October 21, 2026
- Long-term efficacy and safety of tretinoin emollient cream 0.05% in the treatment of photodamaged facial skin: a two-year, randomized, placebo-controlled trial.
Indexed original research abstract plus publisher acknowledgment and financial disclosures; full methods and results not reviewed. · Checked October 22, 2026
- DailyMed - RENOVA- tretinoin cream
Official current labeling retrieved in full · Checked October 21, 2026